More Flapjax, Lying Charts, LLMs in Streamlit and a Python Survey
One of my favourite authors in Data Visualisation, Alberto Cairo, has published a new book. If it is of the same standard as his other work, it will be good; Streamlit has posted the results of a survey about the use of LLMs on their platform as well as publishing a new tutorial on how to build a chatbot using LlamaIndex; and the Python Software Foundation are giving away prizes of $100 for participants in their annual survey. More of that later but first an update on a previous post.
Reusing Flapjax Templates and Code
(Medium article - no paywall).
In the article, Flapjax: Data Visualization on the Web with Plotly and Flask, I suggested that the HTML/Javascript code could be reused but did not demonstrate how, exactly. So, this is a very short article that shows how the template can be reused for a different app with only a few changes to the Python code.
If you refer friends to this Substack and they subscribe (for free) I’ll send you free eBooks - surely this is an offer you can’t refuse!
How Not to Lie with Charts
(Medium article - no paywall)
Alberto Cairo is Spanish but lives and works in the US. He is my favourite type of academic: one that has come from the industry in which he teaches. So, his writing and teaching are not only theoretically based but are also rooted in real-world experience.
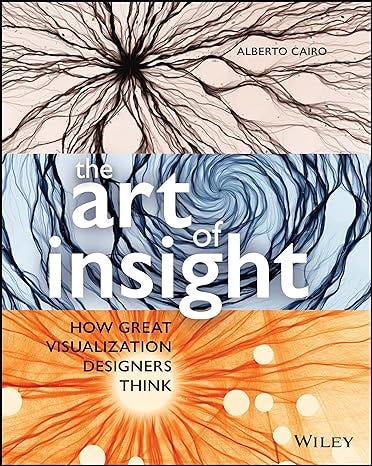
I’ve been reading about his new book, The Art of Insight: How Great Visualization Designers Think, and if it is as good as his other books then it will definitely be worth reading.
I’ve been impressed by Cairo’s books on data visualisation and have found them very useful. One of my favourites is How Charts Lie: Getting Smarter about Visual Information which I used as the inspiration for the above article. It looks at how you can use data visualization to inform, or misinform and looks at the things to avoid if you want to do the former and not the latter.
You can find Cairo’s books here on Amazon (affiliate link) - they are definitely worth a look.
State of Streamlit LLM Apps 2023
Streamlit and Snowflake have published insights gained from the analysis of 21,604 LLM-powered Streamlit built by 13,433 developers and hosted on Streamlit Community Cloud.
They report four main conclusions:
OpenAI is, by far, the most popular LLM, with 74% of developers using GPT models.
Of LangChain and LlamaIndex (frameworks with agents and tools designed to amplify LLM capabilities) the former is growing fast and is generally more used, although, as the publishers point out they are not mutually exclusive and can be used together.
Chatbots are on the rise - they let users iteratively refine answers and allow human-like conversations - although nearly double the number of apps do not use chat interfaces.
Only 20% of apps are using vector databases (which suggests to me that RAG has not taken off yet in the Streamlit world).
More discussion and some pretty charts can be found in the link above.
Streamlit certainly seems to be getting well on board with LLMs (well who isn’t?).
Here we have a Streamlit integrated with LlamaIndex to talk to your data using RAG. And it’s all in 43 lines of code. (Frankly, I don’t know why they emphasize the 43 lines. On the one hand, it looks like it is easy but on the other, if it is only 43 lines it doesn’t seem like a terribly serious amount of work. I’m in two minds about this.)
Anyway, Streamlit says: “Learn how LlamaIndex can enrich your LLM model with custom data sources through RAG pipelines. Build a chatbot app using LlamaIndex to augment GPT-3.5 with Streamlit documentation in just 43 lines of code.”
Sounds good - here’s the article: Build a chatbot with custom data sources, powered by LlamaIndex
Python Developers Survey 2023
And now, as they say, for something completely different…
The Python Software Foundation is carrying out the seventh Python Developers’ Survey and you can win a $100 gift card if you take part.
The goal, according to PSF, “is to capture the current state of the language and the ecosystem around it. By comparing the results with last year’s, we can identify and share with everyone the hottest trends in the Python community and the key insights into it”.
Last year’s results can be found here.


Just added How Charts Lie to my Amazon cart. Thanks for recommending!