
I created a Streamlit Dashboard in less than 5 Minutes with Gemini CLI
Combining the two topics of this Substack, I created a Streamlit dashboard with AI. Here’s a screenshot:
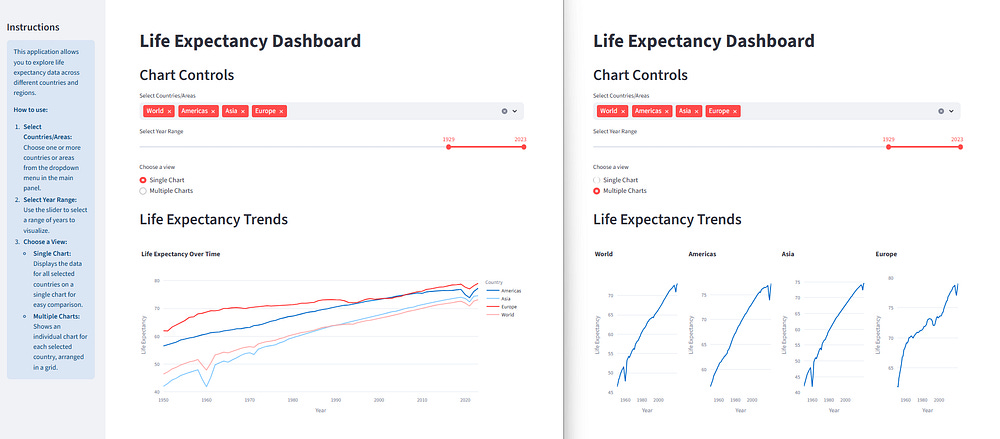
This was a remarkably quick and easy way to create data visualisations directly from the data. You can read the full story here (No paywall):
I created a documented Streamlit Dashboard in less than 5 Minutes with Gemini CLI
Apart from my own work, I’ve been reading some interesting articles in Data Science and AI. Here are a couple that are definitely worth your time.
Agents aren’t always the solution
While reviewing my own recent offering, Build Multi-Agent Apps with OpenAI’s Agent SDK, I came across a very interesting take on the use of AI agents, or indeed, when not to use them.
A Developer’s Guide to Building Scalable AI: Workflows vs Agents shows how a workflow model that uses direct calls to an LLM is often more appropriate than an agentic approach. It does a good job of explaining the pros and cons of the agentic apps and, is a warning that, even if they are fun and sexy, you shouldn’t just grab at the next shiny thing but think a bit more deeply about the nature of your project before diving in. If you are thinking of getting involved in AI app development, this is well worth a read.
A shorter and equally authoritative piece from Anthropic, Building effective agents, also sets out the difference between workflow-based apps and those using agents.
Data Visualization with ChatGPT
is excellent in finding interesting data and presenting it in novel ways. His recent Substack, Is GPT-4o Now Any Better With Data Visualization Report Creation? explores how to use ChatGPT to create PDF reports which include automatically generated charts. His starting point is the Harvard Comparative Death Penalty Database and, as he says, “Bringing death penalty data to life shows us where the world stands on one of the most controversial practices in the legal system.” And he does this by walking us through how to use GPT-4o to analyse the data, produce data visualization and produce a complete report in PDF format.All links are to free articles unless otherwise indicated with a $ after the title.
Support your local bookshop, not billionaires
I’ve created a set of recommended books, mainly about data visualization. They are available on my shopfront on bookshop.org. Books can be delivered from a real shop of your choice. I have a shopfront in the US and the UK. Purchases generate a small commission for me.