Altair: Using the Powerful Vega-Lite 'Grammar of Graphics'
Using the Altair library for Python we can develop compelling data visualizations based on a grammar of graphics and implement them in Streamlit

You’ve probably heard of the most famous implementation of the grammar of graphics: it’s ggplot2 and it is a graphics library for the R language.
But if you are a Pythonista you don’t need to feel left out. Altair implements a (somewhat different) grammar of graphics as defined by Vega-Lite and you can create very nice charts and plots with it.
Read an introduction to Altair, by clicking on the link below (no paywall).
Altair: Using the Powerful Vega-Lite 'Grammar of Graphics'
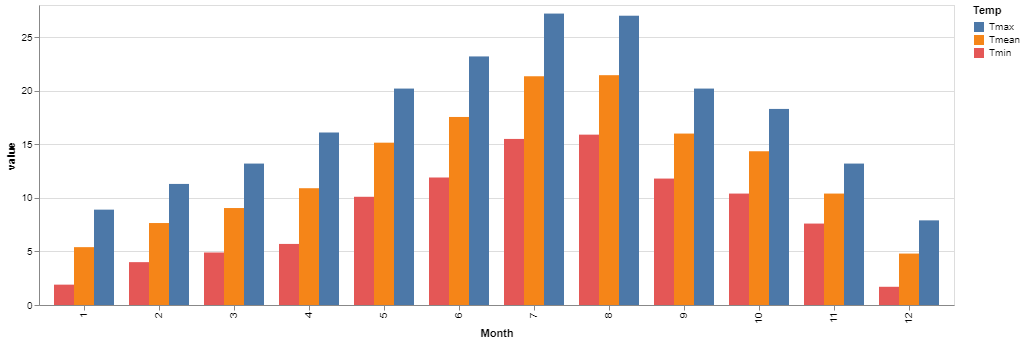
You can see a selection of the charts created in this introduction to Altair, below.


